
Manual / Operations analysis
Rosters, shifts and depots
- For
- a controller or a duty manager
- Status
- current
- Covers
- the Operations Analysis tab's Overview, Depots and Routes sections
- Last checked against the app
6f7727e(2026-08-19)
Three of the tab's seven sections describe the roster as a whole: what there is of it, where it is based, and what it runs. This page is those three, and the handful of words the rest of the tab uses without stopping to define them.
The distinction the whole tab turns on
A shift is one driver's day. A run is one physical bus's day. They are not the same chain and they do not line up:
- a driver changes bus part-way through a shift — the app calls that a bus change;
- a bus is handed from one driver to the next and keeps going — the app calls that a handoff.
Delay rides the bus, not the driver. A late bus stays late when its driver is relieved; a driver who steps onto a different bus starts that leg fresh. So the chain that matters for "what else does this hit" is the bus's, which is why there are two tables — Shifts (drivers) and Runs (buses) — named the way they are, and why the tab keeps saying which one you are in.
The other words this section uses are in the glossary: shift, run, depot, span, layover and dead run.
Overview
Ten tiles across the top, each a number with its label under it and, on most, a one-line gloss.
| Tile | What it counts |
|---|---|
| Shifts (drivers) | Driver days in the loaded roster |
| Runs (buses) | Physical bus-days — the same work, chained by vehicle instead of by driver |
| Service legs | Passenger trips driven |
| Routes operated | Distinct routes the roster works |
| Dead-running legs | Empty repositioning legs — depot to first stop, between two routes, back at the end |
| Bus changes | Times a driver hops to another bus mid-shift |
| Tight turnarounds | Same-bus turnarounds with under five minutes in them |
| Tight handoffs | Shown as a pair: tight handoffs out of all driver handoffs |
| Fragile shifts | Driver days scoring 50 or more for fragility |
| Fragile buses | Bus days scoring 50 or more |
Under the tiles, four cards: Shifts by depot, Shifts by day type and Fleet (bus class), each a bar per category with its count, and Fragility distribution, a histogram with the more fragile shifts to the right. Then Most fragile shifts — the leaders, in the same table shape the Shifts (drivers) section uses.
Day types are the roster's own categories, not calendar dates: Weekdays, Mon–Thu, Friday, Saturday and Sunday.
Fleet (bus class) groups the vehicle types the roster names — Articulated, Electric, Smart, Track, Mini, and Other for anything it does not recognise.
Depots
One row per depot, and it is the operational footprint of each.
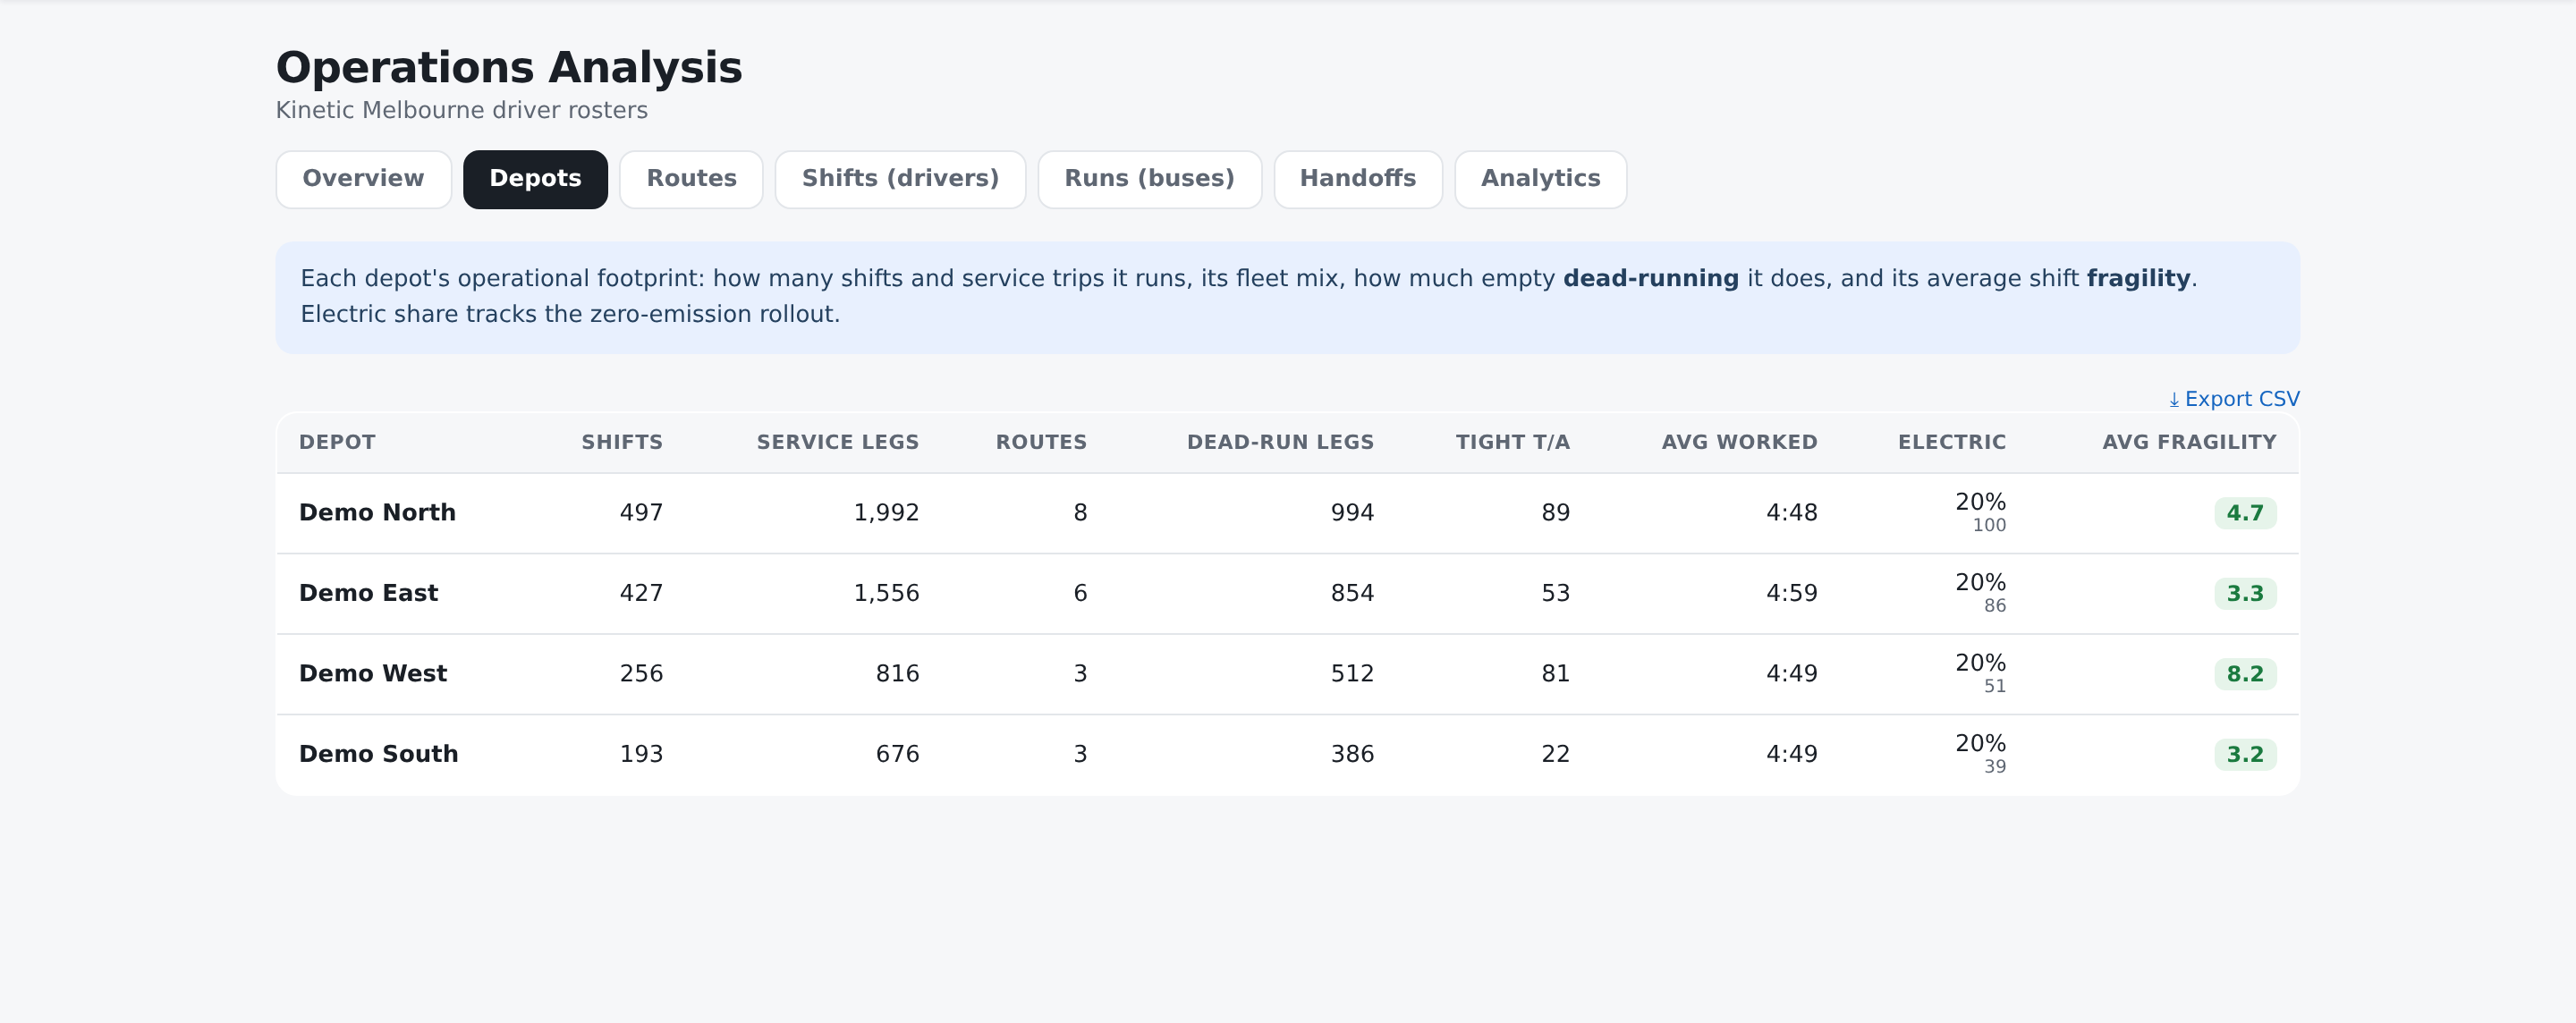
| Column | What it is |
|---|---|
| Depot | Where the drivers on these shifts book on and off |
| Shifts | Driver days based there |
| Service legs | Passenger trips those shifts drive |
| Routes | How many distinct routes they touch |
| Dead-run legs | Empty repositioning legs those shifts contain |
| Tight t/a | Tight turnarounds — same bus, under five minutes |
| Avg worked | The average time a shift there counts as worked |
| Electric | The share of that depot's shifts on an electric bus, with the count under it |
| Avg fragility | The average fragility score of its shifts |
Routes
One row per route the roster works, with a filter box above it — "Filter routes by number or depot…" — and a count of how many of how many are showing.
| Column | What it is |
|---|---|
| Route | The route number |
| Shifts | Driver days that touch it |
| Service legs | Passenger trips on it |
| Depot(s) | Where those drivers book on |
| Fleet | The vehicle classes used on it |
| Days | The day types it is rostered on |
This is the section that answers "who runs the 903, out of where, with what" — a question the Map Explorer and the Timetable tab cannot answer at all, because the published timetable does not say who operates a trip.
What they do not mean
None of these is a count of a day. They are counts of the roster: every Weekdays shift, every Saturday shift and every Sunday shift added together. The Shifts by day type card is the fastest way to see the mix you are actually totalling.
"Tight" is an exact definition, and it is an assumption. A turnaround counts as tight when the same bus has less than five minutes between finishing one service and starting the next. Five minutes is a common minimum layover and it is the line this app uses everywhere, on every screen — but it is a reasonable assumption rather than something measured on this network.
A negative gap is not the tightest turnaround of all. Where the roster has a leg starting before the previous one ends, that is a fault in the paperwork rather than an impossible turnaround, and it is excluded from the tight counts. The Analytics section reports the overlaps separately so they are not simply lost.
Avg worked is not paid hours. It is the time the roster counts as worked in a shift. It is not spread, which is sign-on to sign-off including the break, and it is not a payroll figure.
Electric is a share of shifts, not of buses. It says how much of that depot's rostered work is on an electric vehicle, which is not the same as what proportion of its parked fleet is electric.
Avg fragility is not a performance measure and not a driver measure. It is a structural score from the roster's own chain, and it is explained where it is used, on Allocation.
Depot is where the driver books on. It is not necessarily where the bus is kept, and a shift can work well away from it.
A route missing from Routes is not a route with no buses. The roster covers this operator's own work. Somebody else's routes are in the Map Explorer and the Timetable tab and are simply not in this one.
A count that looks low may be a filter. Routes has its own filter box, and it says "12 of 64 routes" when one is applied.