
Manual / The timetable
Reading a timetable
- For
- a controller or a planner
- Status
- current
- Covers
- the Timetable tab — the route list, the ● Live and Schedule modes, and the Table, Linear, String-line, Allocation, Headway and Punctuality views
- Last checked against the app
6f7727e(2026-08-19)
Pick one route, pick one date, and then look at it six different ways. This page walks the whole screen, names every control, and says what each view is good for — and what none of them is telling you.
What you are looking at
Down the left: choosing a route
The rail is headed Timetable, with the line "Pick a route to explore its runs, live and scheduled." under it, and then:
- a filter box, "Filter routes by number or name…". It matches the route number, the route name and the operator's name;
- the Operator filter, which opens a checklist with All and Clear buttons. Its summary line says All operators, or names the ones you have ticked;
- a count — "64 routes" — of what the two filters have left;
- the route list itself, which you can walk with the arrow keys.
The list opens in the same operator scope as the Map Explorer, so "my routes" means the same thing on both tabs. Change it here and the Explorer is not affected: each tab keeps its own ticks for the session.
Until you pick something the main pane says Timetable views and explains itself. Everything below appears once a route is selected.
Across the top: the route, and the three groups of controls
The header names the route — its number on a coloured badge, its full name, and under that its type and operator. Beside them is a row of small links to the same route elsewhere in the app: Map, Operations and Diversions, each appearing only where this deployment has that tab and you are allowed into it, plus Plan diversion where you may draft one.
On the right of the header, three groups of buttons:
| Group | Buttons | What it changes |
|---|---|---|
| Data source | ● Live · Schedule | Whether you are watching the buses that are out now, or replaying the printed timetable for a date |
| Direction | Both · Outbound · Inbound | Which direction the views describe. The whole group is absent on a route the timetable only publishes one direction for |
| View | Table · Linear · String-line · Allocation · Headway · Punctuality | Which of the six lenses is on screen |
The view buttons work with the keyboard as one control: Left and Right move along them, Home and End jump to the ends, and Enter or Space opens the one you have landed on. Arrowing past a view does not draw it; you have to press.
The two modes
| Mode | What it shows |
|---|---|
| ● Live | The buses that are out on this route now, drawn from the live feed, with each run's lateness. There is no date control and no playback: this is what is happening |
| Schedule | The printed timetable for a date you choose, replayable on a time slider at up to 240 times normal speed |
The app opens in ● Live unless you have set otherwise in ⚙ Settings → Timetable → Opening mode. On a deployment with no live feed the mode button is still there, and the bar along the bottom says so:
Realtime is not configured — switch to Schedule to replay the timetable.
Realtime there means the live bus feed. What the line is telling you is that this copy of the app has not been given one, so ● Live has nothing to draw and Schedule is the mode to work in.
The six views
| View | What it is for |
|---|---|
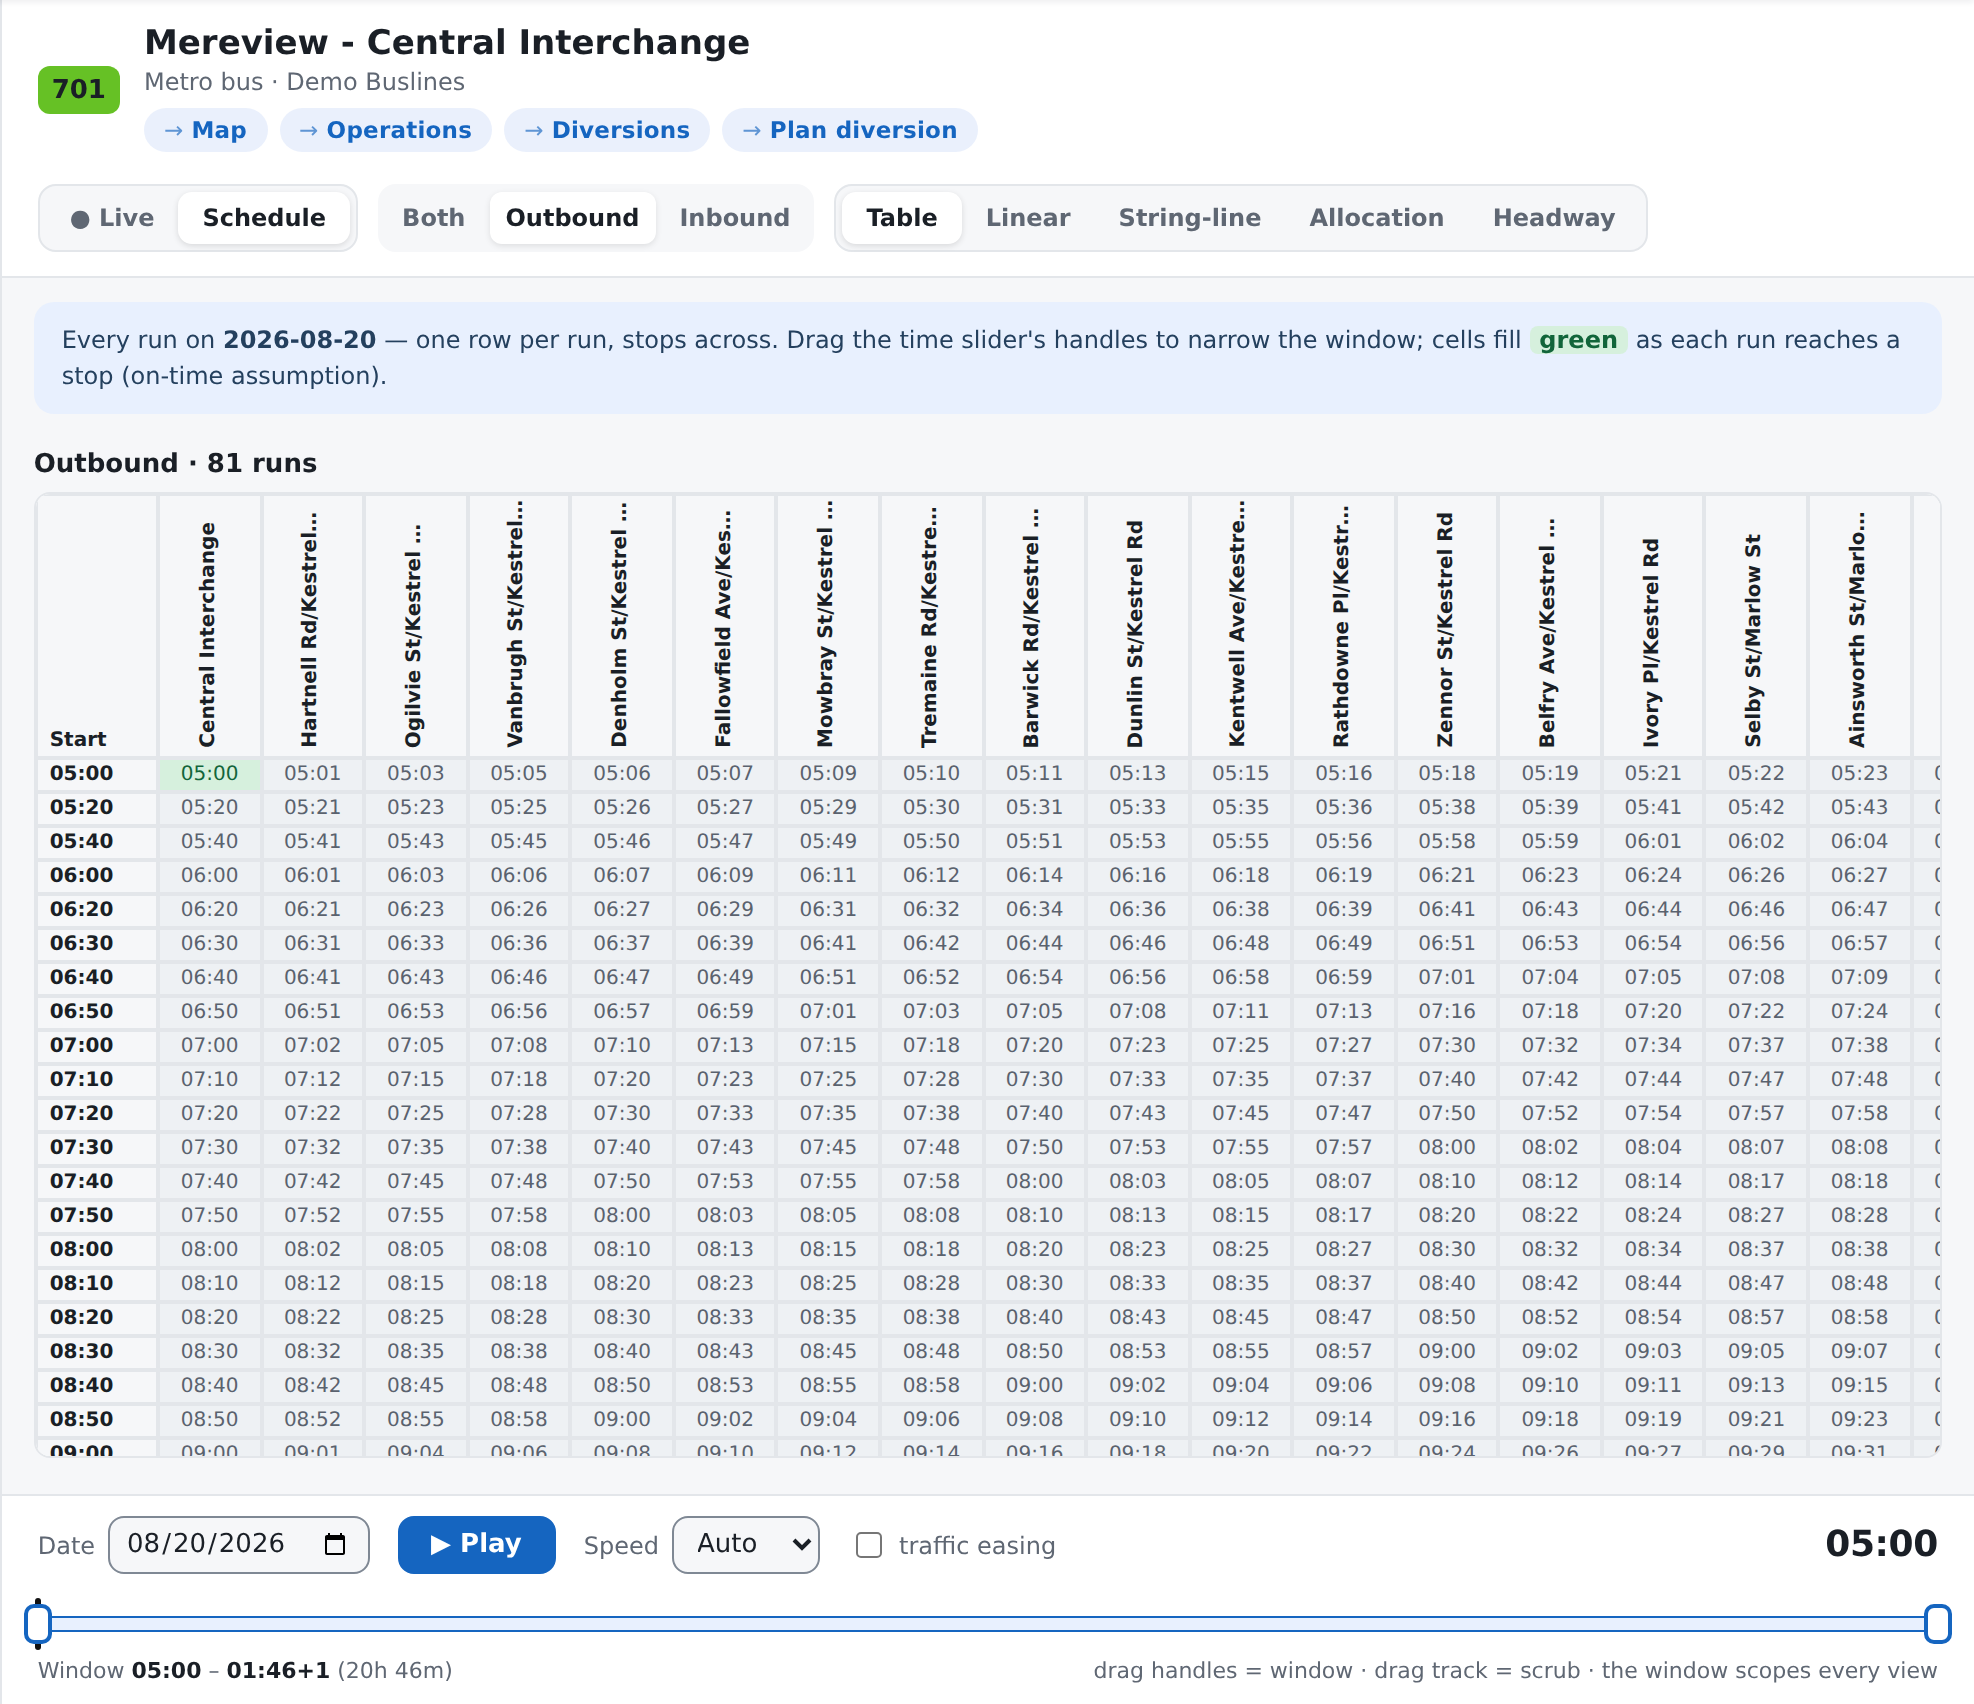
| Table | Every run of the day as a grid — one row per run, the route's stops across the top. The view to reach for when the question is what time a particular run is due at a particular stop |
| Linear | A map of the route beside a strip laid out by real distance along it, with the buses on both. ⤢ Fit route reframes the map; scroll to zoom the strip and Reset zoom puts it back |
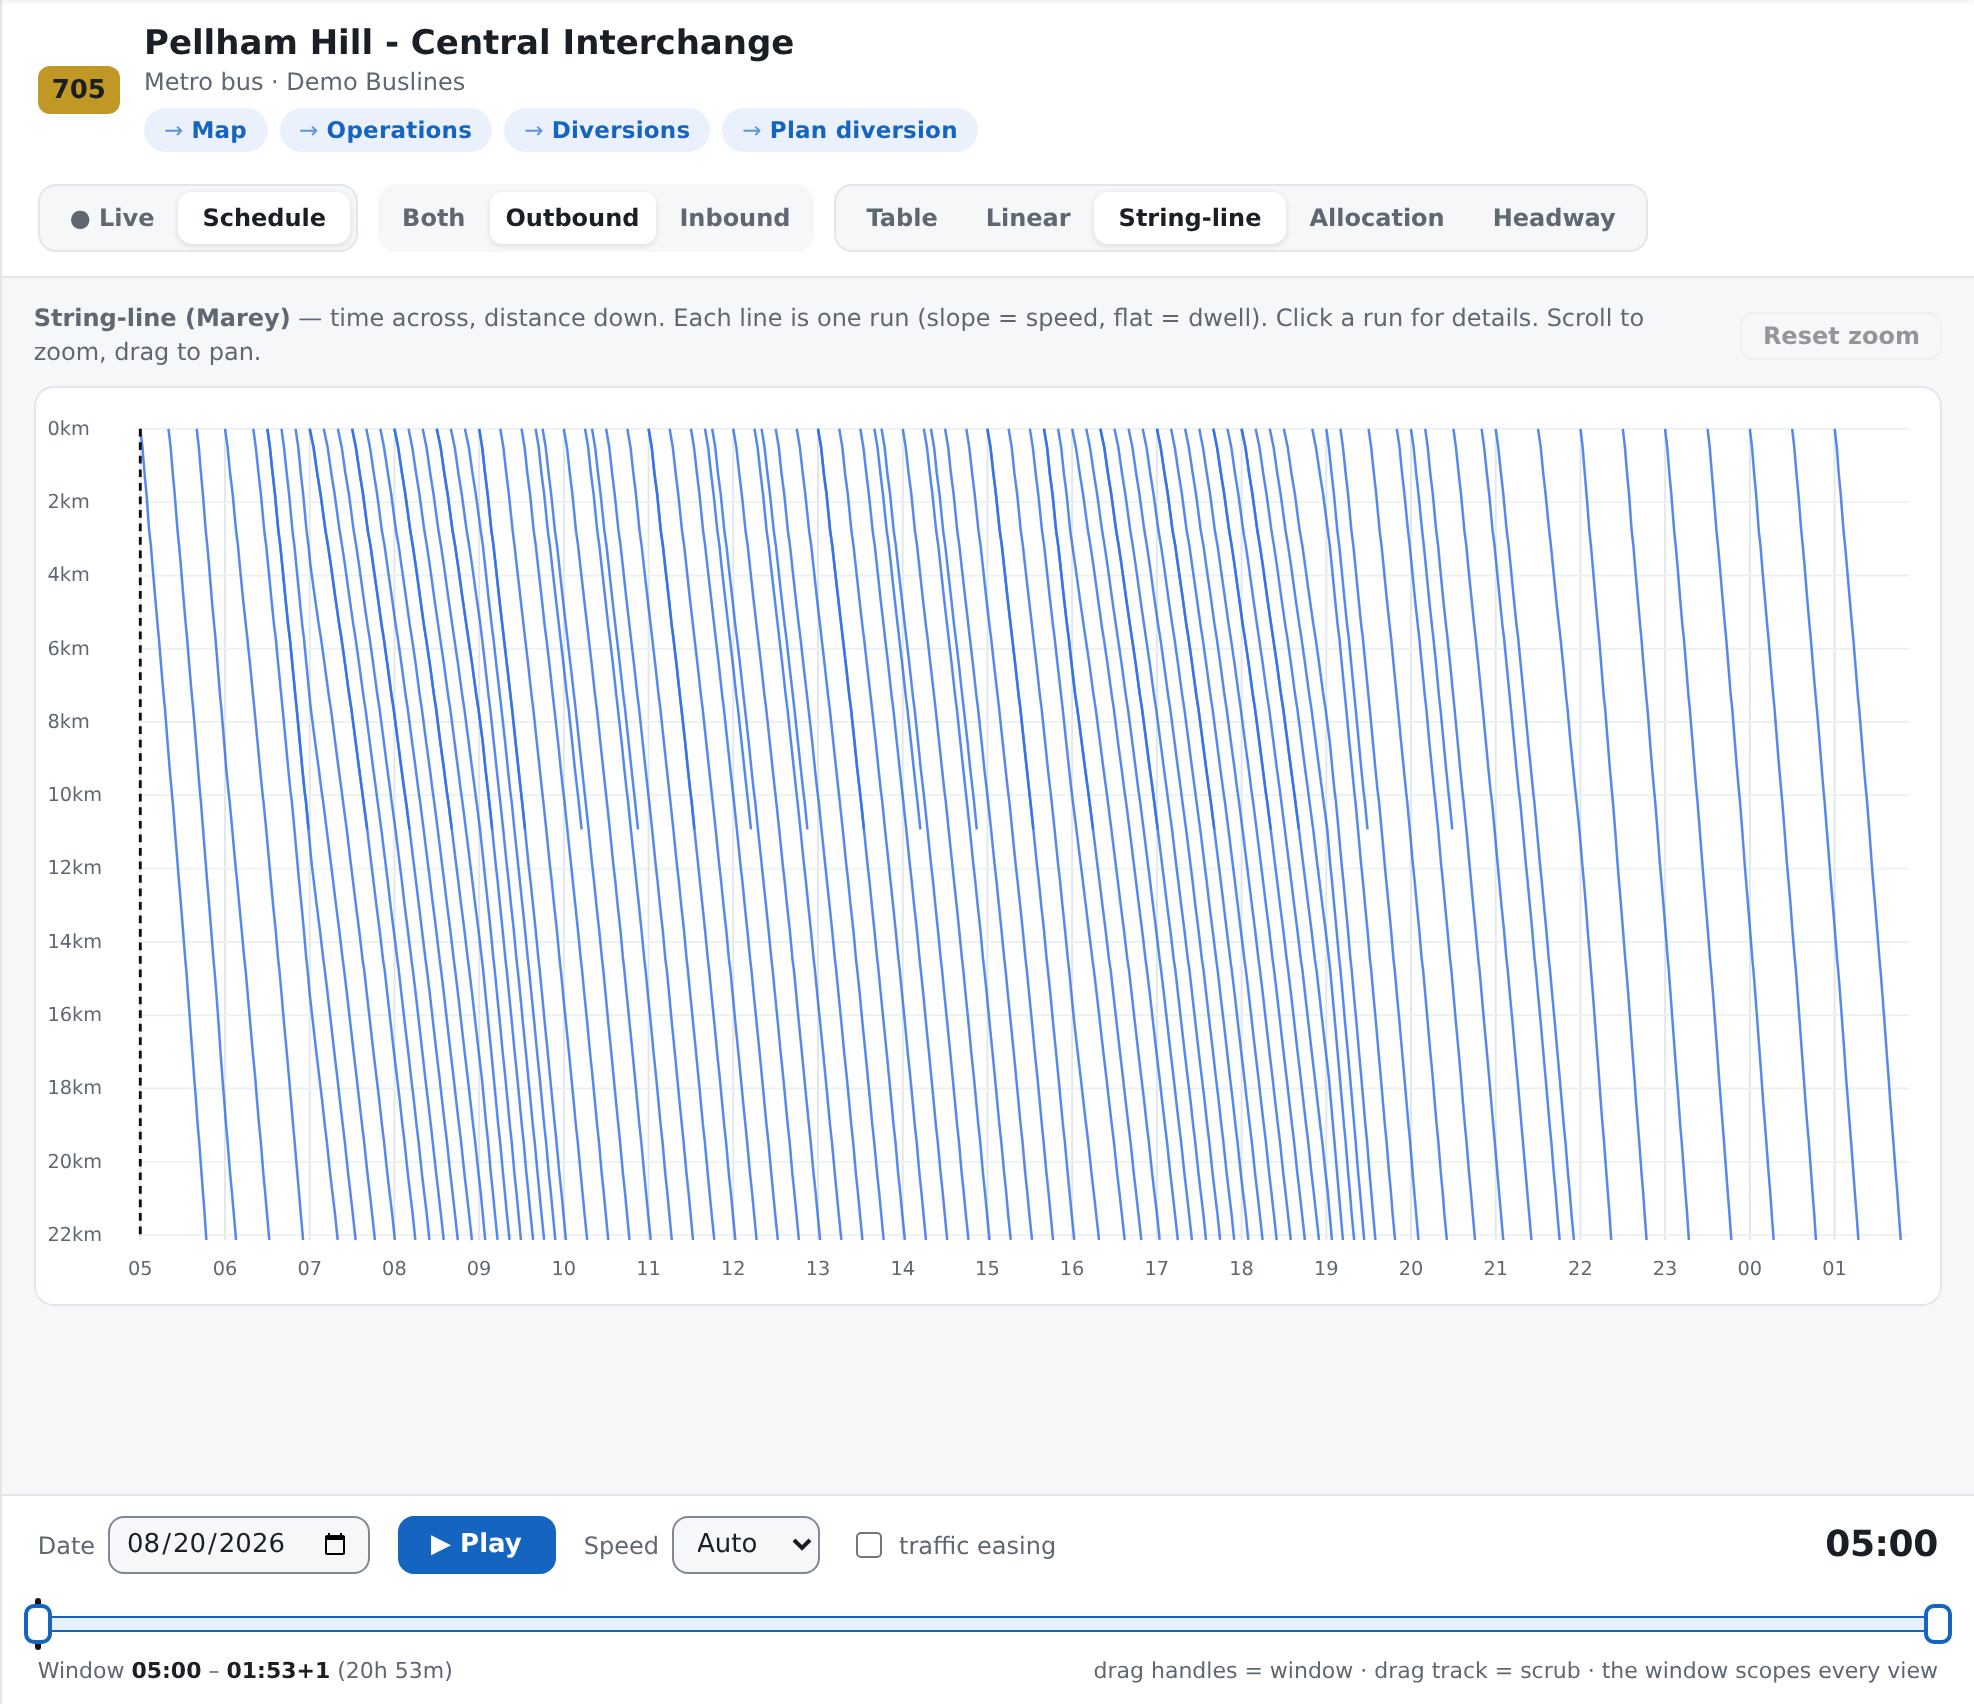
| String-line | Time across, distance down, one line per run. Slope is speed and flat is standing still, so bunching, gaps and a bus losing time all have a shape. Click a line for that run's stop-by-stop detail |
| Allocation | Where the timetable's running time goes, hop by hop. Its own page: The Allocation view |
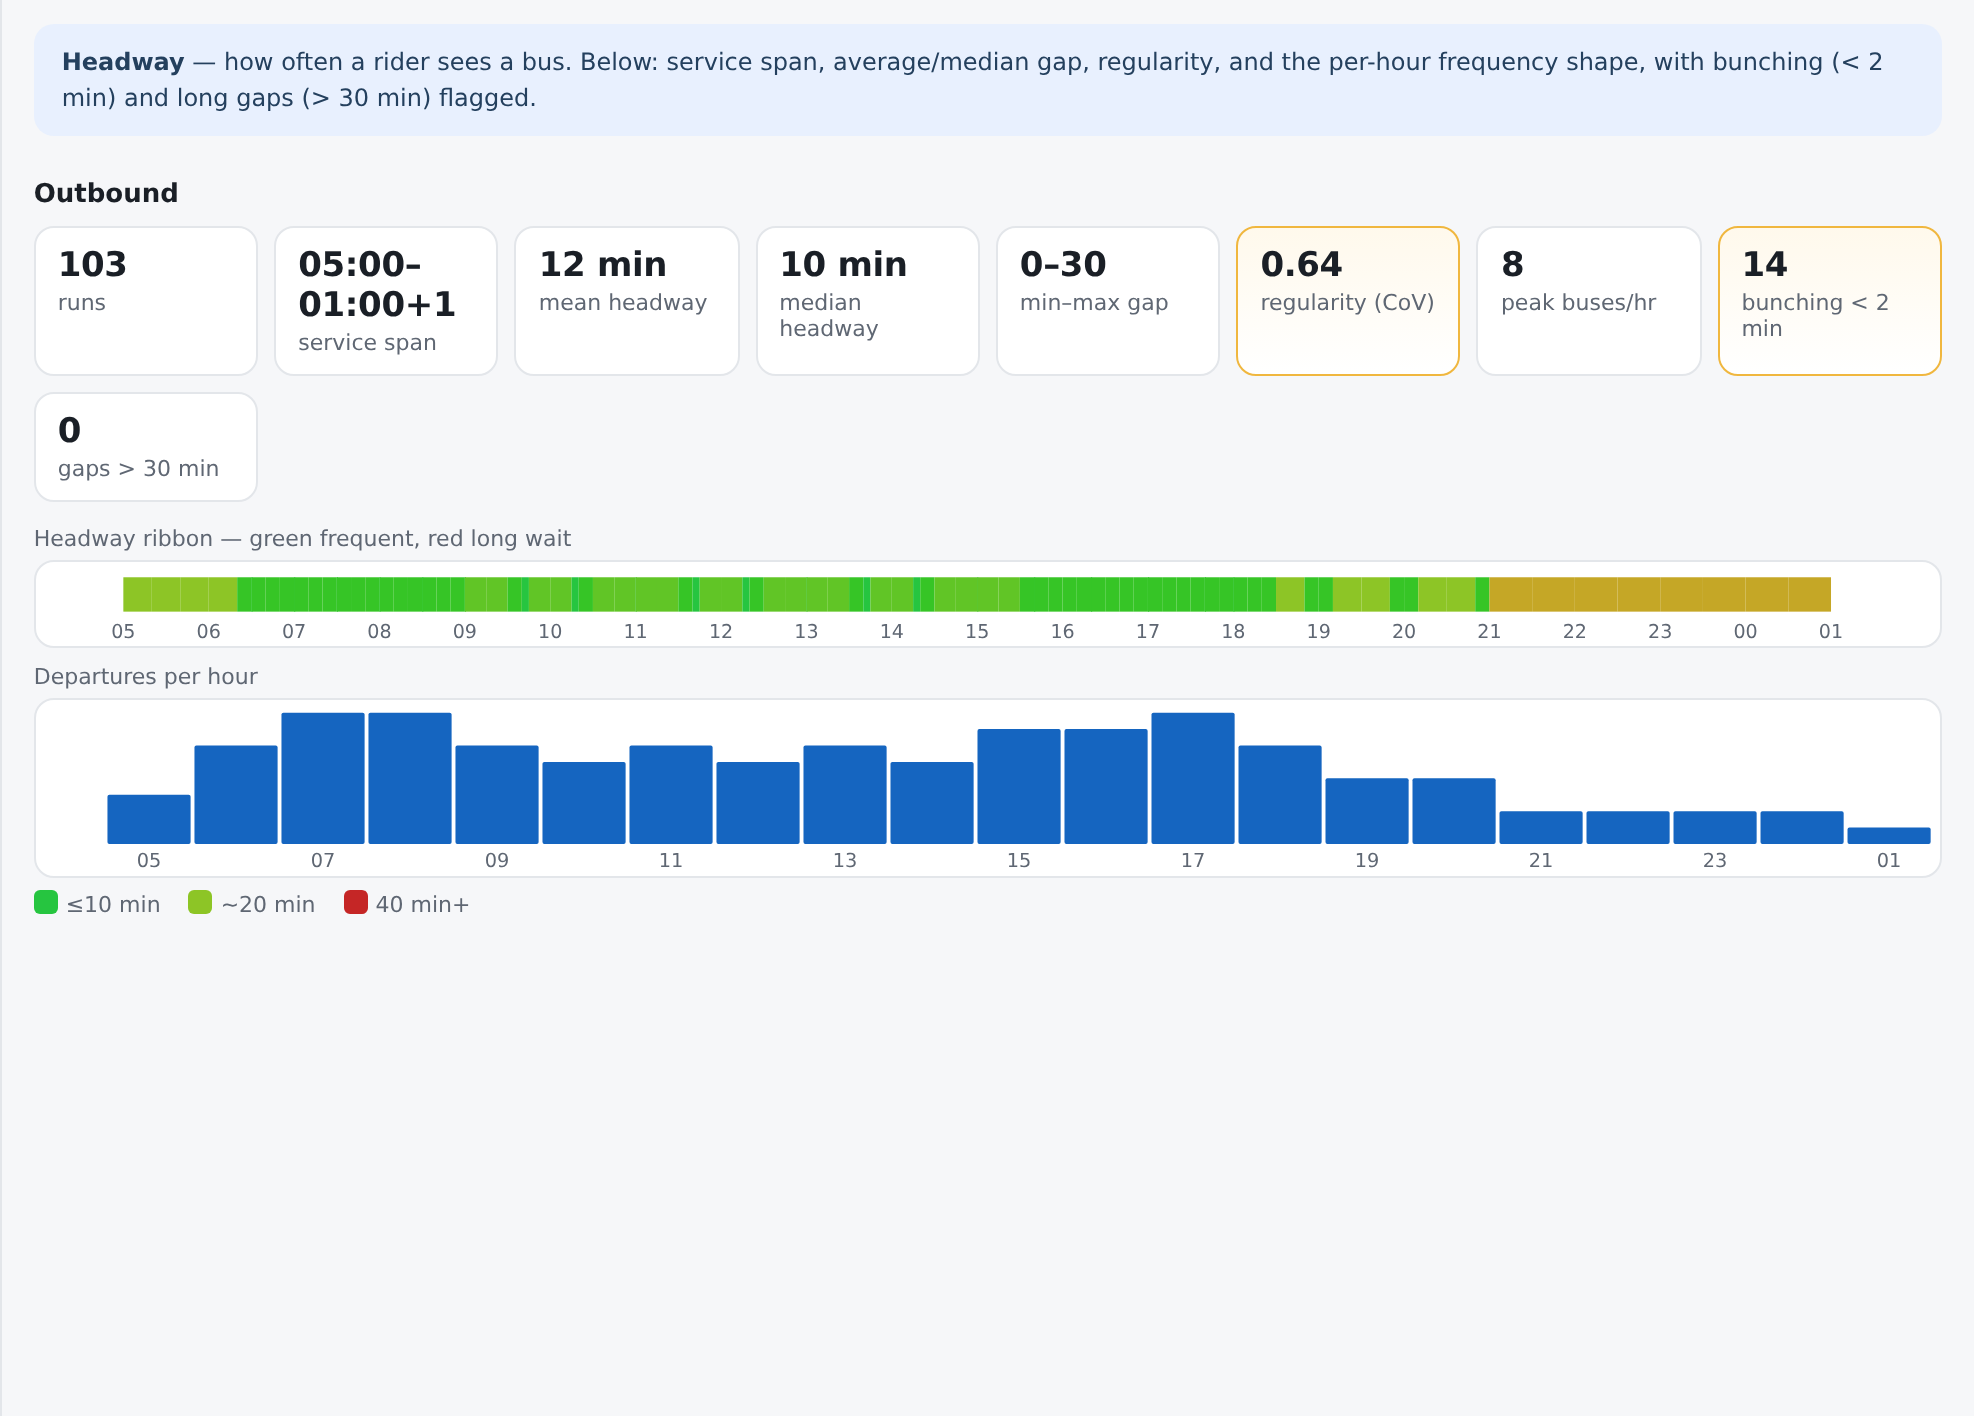
| Headway | How often a rider sees a bus — service span, average and median gap, regularity, and the per-hour shape |
| Punctuality | Observed running time against what was allocated. Present only where observed times have been loaded: Punctuality |
Linear is where the tab opens. ⚙ Settings → Timetable → Opening view changes that.
Along the bottom
In ● Live the bar is a status line: how many live buses are on this route (counted for the direction you are showing, not the whole route), and the time the feed itself was generated. It gains feed stale when the app's last attempt to fetch the feed failed.
In Schedule the bar is the playback controls:
| Control | What it does |
|---|---|
| Date | The service date every view describes. It will not go outside the dates the loaded timetable covers |
| ▶ Play / ❚❚ Pause | Runs the day. On a date the route does not operate it is disabled, its tooltip says why, and the slider is not drawn at all |
| Speed | Seven steps from 1× to 240×, or Auto, which picks the slowest of them that still plays the window through in about three quarters of a minute |
| traffic easing | Makes a replayed bus slow into a stop and pull away from it instead of sliding at a constant rate |
| The clock | Where in the day the replay has reached |
| The Window slider | Two handles and a track. Drag a handle to narrow the window; drag the track to scrub |
The time slider scopes every view
This is the control most worth understanding, because it changes four views at once and it is easy to leave narrowed.
Drag the handles and the Table drops the runs that are not out on the road, the String-line makes the window its whole width, and Allocation and Headway compute their numbers from that set of runs alone. The line under the slider says so: "drag handles = window · drag track = scrub · the window scopes every view".
A run counts as being in the window if any part of its journey is — not if it departs inside it. A bus that left at 07:55 on a 70-minute route is very much part of 08:00–08:30, and a five-minute window would otherwise be empty while eight buses were out on the road.
Nothing is filtered until you move a handle. With both handles at the ends of the day, every view shows the whole day.
What the numbers mean
| On screen | What it is |
|---|---|
| A cell in the Table | That run's departure time from that stop |
| A cell's colour, in ● Live | How late that bus is predicted to be at that stop, in five bands: very early, early, on time, late, very late. Hover the cell for the number of minutes |
| A cell's green fill, in Schedule | The replay has reached that stop. Nothing more |
| A blank cell | This run does not serve that stop |
| The time at the start of a Table row | When that run starts — its first time on the route |
| A ♿̸ beside it | The timetable says that run is not wheelchair accessible |
| runs and service span, in Headway | How many runs start in the window, and the clock time of the first and the last |
| mean headway / median headway | The average and the middle gap between one run starting and the next, in minutes |
| min–max gap | The shortest and longest gap in the window |
| regularity (CoV) | How even the gaps are. Small is even; the tile turns amber past 0.5 |
| peak buses/hr | The busiest single hour's count of runs starting |
| bunching < 2 min / gaps > 30 min | How many gaps fall either side of those two lines |
Under the tiles are two pictures of the same day: the Headway ribbon, one block per gap coloured green for frequent through to red for a long wait, and Departures per hour, a bar per hour.
The five delay bands are the same ones the bus dots on the map wear, and they are the Victorian on-time-running definitions: more than three minutes early, one to three minutes early, one minute early to five minutes late, five to ten minutes late, and more than ten minutes late.
What they do not mean
Live colouring is today only. The Table shades cells against live predictions only when the date is today's service date. On any other date the note above the table says so in as many words and offers Jump to today; the times are the scheduled ones and the cells carry no colour. This is the state the tab opens in when the loaded timetable has expired, because there is then no today for it to show.
A green cell in Schedule mode is not "on time". It means the replay's playhead has passed that stop. Schedule mode asserts nothing at all about lateness — there is no bus in it.
A blank cell is not a zero and not a late bus. It is a stop that run does not serve: a short working that turns back early, or a pattern that misses a loop. The route's full list of stops is across the top, and not every run does all of them.
A grey cell is not "on time" either. In ● Live it means no prediction has been published for that bus at that stop. If the feed goes stale the app drops the predictions rather than painting twenty-minute-old ones as current, so the whole table can go grey while the buses keep moving on the map.
The live count is the direction you are showing. Switch to Inbound and the number in the bar along the bottom falls, because it is counting the same set the view above it is drawing.
No ♿̸ is not a promise of an accessible bus. Only the exception is marked. A run with nothing beside its start time is one the timetable either says is accessible or says nothing about, and those two are not the same — the app cannot tell them apart on screen because marking the 99% that are fine would bury the handful that are not.
traffic easing changes nothing but the animation. It makes a replayed dot ease into and out of each stop instead of sliding evenly. It is not a traffic model, it does not use any road data, and it changes no number anywhere on the tab.
The Headway view is not the map's headway overlay, and neither is punctuality. Three separate things share the word:
- the Headway view here counts the gaps between the scheduled start times of the runs in the window you have set. It is descriptive arithmetic about the timetable, and no bus is in it;
- the map's Frequency overlay — whose panel is headed Headway — measures the live gap between one bus and the next against the scheduled gap, at every stop along a route, and has watch and alarm lines you set yourself;
- lateness is neither. Two buses that are both twelve minutes late are running the gap they were meant to run.
The Headway figures are not a service-quality verdict. Mean, median, regularity, bunching and long gaps are counted over the window you left the slider in. Narrow it to the peak and the route looks frequent; widen it to the whole day and it does not. Both are true; the tile does not say which question you asked.
Distances and positions on Linear are projections. The strip places each stop by how far along the published route shape it falls. Where the app does not trust that shape it says so above the view — "Stop positions and distances on this view are approximate." — and the strip is then a rough ordering rather than a measurement.
The three "nothing here" messages are three different facts, and they are worded apart on purpose:
| Message | What it means |
|---|---|
| "No scheduled runs on …" | This route does not operate on that date at all — a public holiday, or a school-day-only pattern |
| "No runs are out on the road between …" | The route runs that day; your window does not contain any of it. Widen the slider |
| A status line, or an error with Try again | The app is still loading, or the load failed |
When it looks wrong
The tab shows the wrong date and there is no date control. You are in ● Live, which has none. Either press Jump to today in the bar, or switch to Schedule and set the Date.
"Jump to today" is not offered. The loaded timetable does not cover today — it has expired. The bar says which dates it does cover, and the banner under the top bar is reporting the same thing. See The banners, one by one.
The Punctuality button is not there. No observed running times have been loaded on this deployment. It is hidden rather than greyed out because an inert button is a question with no answer.
The direction buttons are missing. The timetable publishes only one direction for this route, so there is nothing to switch between.
The view emptied when you dragged the slider. Look at the Window readout under it. Widen the handles, or drag them back to the ends of the day.